Go to product

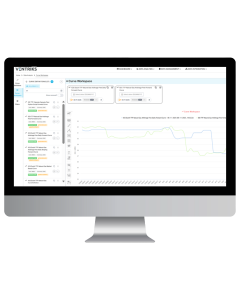
Curve Builder
Monitor, manage, and build forward curves.
Shape and model curves on demand. Create precise mathematical curves for risk modeling, pricing algorithms, and data interpolation with ease.
| Access | API, Cloud, Web Interface |
| Region | Africa, Asia, Europe, Middle-East, North America, South America |
| Format | Cloud formats, CSV, JSON, Python, XLS, XML |
| Frequency | End-of-Day |
| Granularity | 15min |
| History | On request |
Go to product
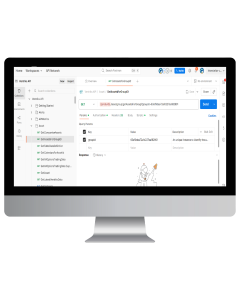
API Services
Connect. Integrate. Succeed.
Comprehensive APIs are at the heart of where data meets integration and becomes reality, with the flexibility to connect and create real business value. Integrate Ventriks data seamlessly into your applications with our powerful, developer-friendly APIs. Get started in minutes with comprehensive documentation and code examples.
| Access | API |
| Region | Africa, Asia, Europe, Middle-East, North America, South America |
| Format | Cloud formats, CSV, JSON, Python, XLS, XML |
| Frequency | Intra-Day |
| Granularity | 1min |
| History | On request |
Go to product

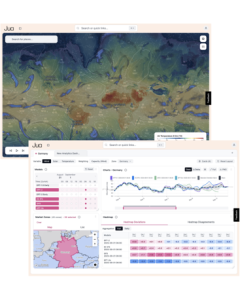
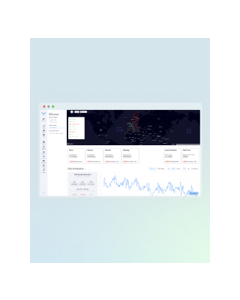
Jua Platform
Weather Intelligence That Powers Energy Markets.
Make smarter trading decisions, optimize renewable operations, and forecast demand with precision. Access the world's most advanced weather models, real-time market aggregates, and AI-powered insights designed for energy professionals. Get access to weighted energy forecasts, dynamic global weather maps, point forecast analysis, and now, Oracle.
Oracle allows users to query very specific requests, which unlocks new dimensions for individual modification and a broad range of different use cases. From setting up trading nudges to generating a visualized overview of your renewable energy assets - with Oracle, you can do it all! Now available on the Jua Platform.
| Access | API, Web Interface |
| Region | Global |
| Format | HTML, JSON, SaaS |
| Frequency | Real-time |
| Granularity | hourly |
| History | On request |
Go to product

Jua API
Weather API for Developers.
Integrate our powerful weather forecasting capabilities directly into your applications with comprehensive API access to all weather models. Unlock smarter decisions across trading, renewable operations, and demand forecasting. With just a few clicks, you can access Jua’s cutting-edge EPT-2 models, rely on established numerical weather predictions, or explore next-generation AI-powered forecasts such as Microsoft Aurora or GraphCast – and even combine them for maximum accuracy. Our transparent, usage-based pricing ensures that you only pay for the data you actually query, giving you full flexibility and cost control.
Interested? Read more here.
| Access | API |
| Region | Global |
| Format | JSON, Xarray, Zarr |
| Frequency | Real-time |
| Granularity | hourly |
| History | On request |
Go to product

Jua EPT-2e
Our most precise model yet: Hedge against weather forcasting uncertainties with EPT-2 Ensemble.
EPT-2e is Jua’s state-of-the-art, 30-member ensemble model designed for fully probabilistic forecasting. By clearly outperforming long-standing benchmarks like the HRES and ECMWF ensemble means, it redefines accuracy and reliability in medium- to long-range weather predictions. For energy traders, this means sharper demand forecasts, better risk hedging, and stronger confidence in long-horizon positions. Updated daily—and available via platform, API, or SDK—EPT-2e delivers the insights you need to optimize trading strategies and navigate volatile markets with precision.
| Access | API, Web Interface |
| Region | Global |
| Format | HTML, JSON, SaaS |
| Frequency | Real-time |
| Granularity | hourly |
| History | On request |
Go to product

Jua EPT-2 Rapid Refresh
Always get the latest weather data with Rapid Refresh
EPT-2 Rapid Refresh is Jua’s fastest global forecast, updated 24 times per day—every single hour. Powered by direct satellite observations, it delivers real-time accuracy far beyond traditional models that refresh only four times daily. For spot energy traders, Rapid Refresh means staying ahead of sudden weather shifts, optimizing intraday positions, and making confident calls in volatile markets.
| Access | API, Web Interface |
| Region | Global |
| Format | HTML, JSON, SaaS |
| Frequency | Real-time |
| Granularity | hourly |
| History | On request |
Go to product

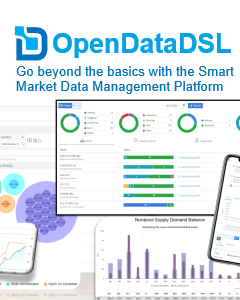
OpenDataDSL Platform
Cloud SaaS Data Management Platform.
Turn complex data into clarity
OpenDataDSL is a cloud-native, ultra-scalable platform designed to transform how businesses manage, model, and interact with market data. By combining transparency, extensibility, and advanced automation, it empowers teams to go beyond the limits of legacy systems.
Why OpenDataDSL?
ODSL Programming Language – A unique domain-specific language that lets “business coders” easily query, transform, and automate workflows with market data.
Operational Transparency – Built-in dashboards, dataset monitoring, and curve management provide unmatched visibility and control across the entire data pipeline.
Extensible by Design – Both the web application and ODSL are designed for partners and clients to create pluggable extensions, ensuring the platform grows with your business.
Cloud-Native & Scalable – Zero-deployment, SaaS-first architecture that adapts seamlessly to your workloads—delivering performance without hidden costs.
Smarter Curves – Advanced curve building tools that use business rules and AI-driven logic to create accurate forward curves, faster.
The Open in OpenDataDSL
Open is more than just a name—it’s a philosophy. We believe in transparency, honesty, and giving customers the ability to build their own insights, KPIs, and workflows without being locked into rigid, opaque platforms.
Shaping the Future of Market Data
With over two decades of expertise in market data systems, OpenDataDSL is built for energy, commodities, and beyond—helping companies unlock real-time analytics, embrace AI, and gain a competitive edge in a rapidly evolving landscape.
| Access | API, Browser, Cloud, Excel, Web Interface |
| Region | Global |
| Format | CSV, HTML, JSON, SaaS, XLS, XML |
Go to product

Carbon Watch
Real-time EU and UK ETS emissions monitoring.
Kayrros Carbon Watch provides realtime physical demand for EU & UK carbon credits by country and sector, including live industrial emissions, with unmatched accuracy by leveraging satellite imagery and AI.
| Access | API, Email, Web Interface |
| Region | EU, UK |
| Format | JSON, XLS |
| Frequency | daily |
| Granularity | daily |
| History | > 2016 |
Go to product

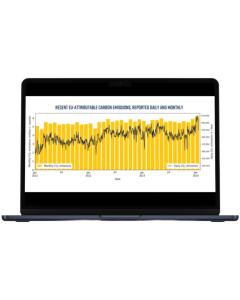
CargoMetrics Maritime Emissions - EU ETS Carbon Tracker
Better-Built Data.
The CargoMetrics Maritime Emissions - EU ETS Carbon Tracker reports daily tons of maritime carbon (CO2) emissions that are subject to the European Union Emissions Trading System (EU ETS), the world’s leading greenhouse gas trading scheme. The Maritime Emissions - EU ETS Carbon Tracker is derived from our industry leading digital representation of the physical characteristics and real-world operation of vessels.
| Access | Amazon Data Exchange |
| Region | Europe |
| Format | CSV |
| Frequency | daily |
| Granularity | daily |
| History | ≥ 2013 |
Go to product
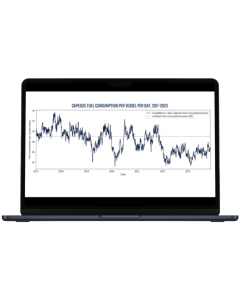
CargoMetrics Maritime Emissions - Global Benchmark
Better-Built Data.
The CargoMetrics Maritime Emissions - Global Benchmark products represent the most comprehensive and insightful carbon (CO2) emissions and fuel consumption data available. The products are derived from our industry leading digital representation of the physical characteristics and real-world operation of vessels and are available by vessel class (tanker, dry bulk, container) and vessel size in daily, weekly, and monthly versions.
| Access | Amazon Data Exchange |
| Region | Global |
| Format | CSV |
| Frequency | daily |
| Granularity | daily, weekly, monthly |
| History | ≥ 2013 |
Go to product

ISPEX Kompass
Energy data, analysis and forecasts at a glance - edited for purchase managers in German language.
ISPEX Kompass provides market information to purchase managers across industries. Data meets editorial content in a unique fashion, allowing for fast and comprehensive understanding of key price drivers and latest developments. Technical purchasing signals support decision making as does our integrated Charting tool. As an essential toolbox for risk management based on information related to energy ISPEX Kompass is accompanied by our energy market analysis as well as our interactive webinar 'Energiefrühstück' on a monthly basis. Please note: We offer our services primarily in German.
| Access | Web Interface |
| Region | DE, Europe |
| Format | HTML |
| Frequency | daily |
| Granularity | hourly, daily |
| History | up to 25 years |
Go to product


e*star Market Place
The e*star Market Place is a full-fledged trading platform operated by a commodity trading company.
Additional to internal trading, it also supports order routing to external execution venues by leveraging the external market access provided by e*star Energy Trader.
| Access | API, Dashboard |
| Region | Global |
| Exchanges | CME, EEX, EPEX Spot, ETPA, ICE, Nasdaq, Nord Pool, Others |
| Format | Java |
| Frequency | Real-time |
| Granularity | Tick-data |
| History | Historical data and backtesting on request |
Go to product

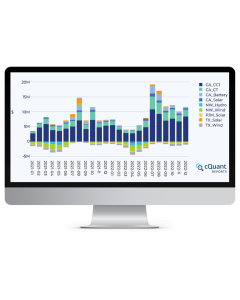
cQuant Analytics Platform
Powering the Future of Energy and Commodity Analytics
Are you still using spreadsheets, old software, or building one-off analytics? Our modern analytics platform enables portfolio and risk managers to do more, faster. The cQuant analytics platform is cloud-native, accessible from anywhere, and requires minimal set up time. The cQuant Analytics Platform provides simulation based analytics of prices, assets, contracts and entire portfolios. cQuant enables companies to plan, optimize and manage their energy and commodity portfolio.
Access our Analytics Platform for:
- Price forecasting & simulation
- Total Portfolio Analysis
- Renewable & carbon analysis
- Battery storage optimization
- Portfolio optimization
- Hedge optimization
- Risk assessment
| Access | Web Interface |
| Region | Europe, North America |
| Format | CSV, HTML |
| Frequency | daily |
| Granularity | hourly, daily |
| History | 2016 |
Go to product

e*star Live Data Portal
The e*star Live Data Portal is an advanced application that offers thorough and real-time market coverage.
With seamless connectivity to all important venues, the Live Data Portal provides users with access to various exchange and broker market data feeds, allowing them to stay up-to-date with the latest market developments. By providing access to the whole curve.
| Access | API, Dashboard |
| Region | Global |
| Exchanges | CME, EEX, EPEX Spot, ETPA, ICE, Nasdaq, Nord Pool, Others |
| Format | Java |
| Frequency | Real-time |
| Granularity | Tick-data |
| History | Historical data and backtesting on request |
Go to product

e*star Market Adapter
e*star Market Adapter is a modular solution that offers a central point of information for trades and real-time market data.
It provides all data fields from the underlying markets - distributing trade and market data through multiple channels to feed systems of any size, from a simple Excel sheet to a full-blown position management system.
| Access | API, Dashboard |
| Region | Global |
| Exchanges | CME, EEX, EPEX Spot, ETPA, ICE, Nasdaq, Nord Pool, Others |
| Format | Java |
| Frequency | Real-time |
| Granularity | Tick-data |
| History | Historical data and backtesting on request |
Go to product

EEX Group Desktop Application
The Desktop App enables users to receive real-time commodity and transparency data.
Historical and real-time data for trading, order book and transparency data as well as prices, volumes and indices are provided. The Desktop App includes real-time commodity quotes, dynamic commodity charting software, real-time forward curve construction, options analytics, real-time alerts and access to technical studies and trend analyses.
| Access | Desktop Application |
| Region | AT, BE, BG, CH, CZ, DE, ES, FR, GB, HU, IT, JP, NL, NO, PL, RO, RS, SE, SI, SK |
| Format | HTML |
| Frequency | Real-time |
| Granularity | < 15min |
| History | > 2018 |