Go to product


Weather API
High-Resolution Weather Intelligence That Drives Energy Performance.
The Meteomatics Weather API turns weather data into a strategic advantage for energy companies. Instead of juggling fragmented sources, you get a single, high-reliability feed that delivers exactly the insights needed to forecast supply, balance the grid, protect assets, and optimize trading decisions.
| Access | API |
| Region | Global |
| Format | CSV, HTML, JSON, NetCDF, XML |
| Frequency | ≥ 5min |
| Granularity | 90 meters |
| History | ≥ 1940 |
Go to product

EURO1k
Precision Weather Intelligence for High-Stakes Energy Decisions.
EURO1k gives energy companies the hyperlocal clarity they need to optimize renewable output, stabilize the grid, and improve trading performance, even in the most weather-sensitive regions of Europe. Instead of relying on coarse global models that blur crucial detail, EURO1k pinpoints the atmospheric dynamics that directly impact operational and commercial outcomes.
| Access | API |
| Region | Europe |
| Format | CSV, HTML, JSON, NetCDF, XML |
| Frequency | hourly |
| Granularity | Native 1 km, 15 min |
| History | ≥ 2023 |
Go to product
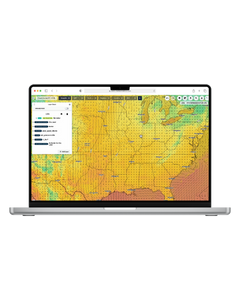
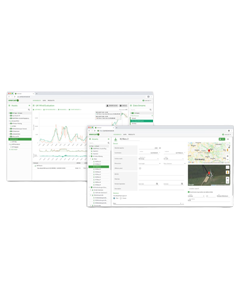
MetX
Weather Intelligence You Can See, Understand, and Act On.
MetX turns high-resolution weather data into immediate operational awareness for energy companies. Instead of sifting through raw forecasts or static dashboards, you get a real-time, interactive view of the conditions that drive generation, demand, and risk, all powered directly by the Meteomatics Weather API.
| Access | Web Interface |
| Region | Global |
| Format | CSV, JSON |
| Frequency | ≥ 5min |
| Granularity | 90 meters |
| History | ≥ 1940 |
Go to product

Portfolio Power Forecasts
Asset-Specific Renewable Forecasts That Strengthen Operations and Trading Performance.
Portfolio Power Forecasts give energy companies a sharper, site-specific view of how their wind, solar, and hydro assets will perform, enabling more accurate planning, tighter risk control, and better commercial results. Instead of relying on generic model output, you get forecasts calibrated to your actual assets, continuously refined with live operational data.
| Access | sFTP |
| Region | Global |
| Format | CSV, JSON, XML |
| Frequency | 15min |
| Granularity | 90 meters |
| History | ≥ 1940 |
Go to product


Data Platform
The Complete Data Platform.
A unique open platform, best-in-class data and expertise - all the ingredients for executing critical data management, analytics and business intelligence decisions with confidence.
| Access | API, Cloud, Web Interface |
| Region | Africa, Asia, Europe, Middle-East, North America, South America |
| Format | Cloud formats, CSV, JSON, Python, XLS, XML |
| Frequency | Intra-Day |
| Granularity | 1min |
| History | On request |
Go to product
Curve Builder
Monitor, manage, and build forward curves.
Shape and model curves on demand. Create precise mathematical curves for risk modeling, pricing algorithms, and data interpolation with ease.
| Access | API, Cloud, Web Interface |
| Region | Africa, Asia, Europe, Middle-East, North America, South America |
| Format | Cloud formats, CSV, JSON, Python, XLS, XML |
| Frequency | End-of-Day |
| Granularity | 15min |
| History | On request |
Go to product

Data Marketplace
Discover, buy and monetise data.
Our marketplace provides access to premium data sources, supporting asset allocation decisions, portfolio construction, and advanced risk and performance analysis.
| Access | API, Cloud, Web Interface |
| Region | Africa, Asia, Europe, Middle-East, North America, South America |
| Format | Cloud formats, CSV, JSON, Python, XLS, XML |
| Frequency | Intra-Day |
| Granularity | 1min |
| History | On request |
Go to product

API Services
Connect. Integrate. Succeed.
Comprehensive APIs are at the heart of where data meets integration and becomes reality, with the flexibility to connect and create real business value. Integrate Ventriks data seamlessly into your applications with our powerful, developer-friendly APIs. Get started in minutes with comprehensive documentation and code examples.
| Access | API |
| Region | Africa, Asia, Europe, Middle-East, North America, South America |
| Format | Cloud formats, CSV, JSON, Python, XLS, XML |
| Frequency | Intra-Day |
| Granularity | 1min |
| History | On request |
Go to product
Quality Manager
Infinite Quality Rules.
We help you manage data quality challenges. End-to-end data quality management with ownership, lineage tracking, reporting, and automated workflows.
| Access | API, Cloud, Web Interface |
| Region | Africa, Asia, Europe, Middle-East, North America, South America |
| Format | Cloud formats, CSV, JSON, Python, XLS, XML |
Go to product

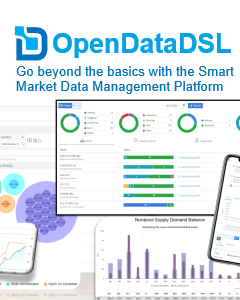
OpenDataDSL Platform
Cloud SaaS Data Management Platform.
Turn complex data into clarity
OpenDataDSL is a cloud-native, ultra-scalable platform designed to transform how businesses manage, model, and interact with market data. By combining transparency, extensibility, and advanced automation, it empowers teams to go beyond the limits of legacy systems.
Why OpenDataDSL?
ODSL Programming Language – A unique domain-specific language that lets “business coders” easily query, transform, and automate workflows with market data.
Operational Transparency – Built-in dashboards, dataset monitoring, and curve management provide unmatched visibility and control across the entire data pipeline.
Extensible by Design – Both the web application and ODSL are designed for partners and clients to create pluggable extensions, ensuring the platform grows with your business.
Cloud-Native & Scalable – Zero-deployment, SaaS-first architecture that adapts seamlessly to your workloads—delivering performance without hidden costs.
Smarter Curves – Advanced curve building tools that use business rules and AI-driven logic to create accurate forward curves, faster.
The Open in OpenDataDSL
Open is more than just a name—it’s a philosophy. We believe in transparency, honesty, and giving customers the ability to build their own insights, KPIs, and workflows without being locked into rigid, opaque platforms.
Shaping the Future of Market Data
With over two decades of expertise in market data systems, OpenDataDSL is built for energy, commodities, and beyond—helping companies unlock real-time analytics, embrace AI, and gain a competitive edge in a rapidly evolving landscape.
| Access | API, Browser, Cloud, Excel, Web Interface |
| Region | Global |
| Format | CSV, HTML, JSON, SaaS, XLS, XML |
Go to product


Demand Forecasts
‘Demand Forecasts’ by Yes Energy enable you to make the most informed decisions possible when buying and selling in organized wholesale markets in Europe, New Zealand, Australia, Japan, Philippines, North America, and other regions.
Generated with proprietary forecasting engines, ‘Demand Forecasts’ by Yes Energy feed comprehensive weather variables and calendar information to proprietary algorithms. The advanced regression models use detailed demand and weather observation history and incorporate the latest near-term data to respond to changing weather patterns, extreme weather events, and holidays that might impact energy demand. This is all backed by an expert team of analysts and engineers reviewing and maintaining every model, ensuring the most accurate and reliable forecasting in the industry.
| Access | API, Cloud, Web Interface |
| Region | Asia, Australia, Europe, New Zealand, North America |
| Format | CSV, HTML, JSON, XLS, XML |
| Frequency | hourly |
| Granularity | 15min |
| History | ≥ 2019 |
Go to product

North American Power Market Data
Analytics-Ready ISO Power Market Data to Fuel Trading Strategies.
North American Power Market Data’ by Yes Energy is the most comprehensive, high-frequency collection of North American power market data available — purpose-built to support energy analytics, forecasting, risk management, and quantitative trading. With coverage spanning from each Independent System Operator’s (ISO) inception to real-time operations today, Yes Energy data enables users to analyze market behavior with both deep historical context and real-time insights.
| Access | Amazon S3, API, Cloud, Web Interface |
| Region | North America |
| Format | CSV, HTML, JSON, XLS, XML |
| Frequency | Near-real-time |
| Granularity | Near-real-time |
| History | ≥ 2003 |
Go to product

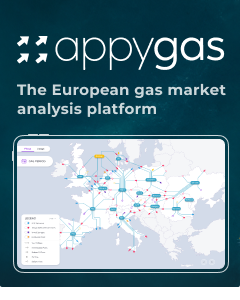
appygas
The European gas market analysis platform - Gas market made easy.
appygas is a leading data service offering near real-time insights into the gas market. It provides detailed information on gas flows at interconnection points, storages, LNG terminals, production and consumption points. With tools for calculating transportation costs, monitoring maintenance events in the gas grid, and accessing data on auctions, spreads, and available capacities, appygas empowers you with the knowledge you need.
Gain full visibility over European gas markets with appygas, for smarter, faster decision-making.
The solution simplifies your job by streamlining data sources and giving you a clear reading of all relevant gas data.
| Access | API, Web Interface |
| Region | Europe, UK |
| Format | CSV, JSON, XLS, XML |
| Frequency | hourly |
| Granularity | daily |
| History | > 2018 |
Go to product

Amperon Forecasting Analytics
Our AI-powered forecasting solutions let you track, plan and optimize your energy needs for the evolving power markets.
Amperon provides AI-powered electricity forecasting and analytics solutions for every electron on the grid. With best-in-class data management infrastructure and consistent AI/ML models at its core, Amperon improves grid reliability, manages financial risk, optimizes renewables, and accelerates decarbonization.
| Access | API, Web Interface |
| Region | Australia, DE, DK, ES, FR, GB, IE, IT, NL, North America, PT |
| Format | CSV, HTML |
| Frequency | hourly |
| Granularity | hourly |
| History | ≥ 2021, On request |
Go to product

Market Continuity
Avoid time-consuming ad-hoc requests after entering an energy market.
Time2Market offers a complete market management package to ensure you spend minimal time on fulfilling administrative requirements toward the markets you are already trading.
Please note that Market Continuity is only available for markets which Time2Market has provided market access to, as we cannot guarantee the quality of the entry service otherwise.
| Access | Email, Physical Meeting, Virtual Meeting |
| Region | Australia, Europe, North America |
| Format | CSV, PDF |
Go to product


Outsourced Market Operations
Energy One provides 24/7 or Out-of-Hours gas and power operations and dispatching services.
Our team of 40+ experienced gas and power operators works out of three control rooms based in Paris (France), Aalst (Belgium) and Adelaide (Australia) using a follow-the-sun approach. This means that we ensure you always have operators working in daytime hours to manage nominations, bidding, scheduling and portfolio balancing on your behalf. Several of our experts have moved from our European offices to Australia, where they are taking care of the European night shift, ensuring you always have a fresh pair of eyes watching over your portfolio.
| Access | Direct Phone, Email, sFTP, Web Interface |
| Region | Australia, Europe, UK |
| Format | CSV, JSON, XLS, XML |
| Frequency | Real-time |
| Granularity | 5, 15, 30 or 60 min |
| History | Full history available, daily handover reports and audit logs |
Go to product

CargoMetrics Maritime Emissions - EU ETS Carbon Tracker
Better-Built Data.
The CargoMetrics Maritime Emissions - EU ETS Carbon Tracker reports daily tons of maritime carbon (CO2) emissions that are subject to the European Union Emissions Trading System (EU ETS), the world’s leading greenhouse gas trading scheme. The Maritime Emissions - EU ETS Carbon Tracker is derived from our industry leading digital representation of the physical characteristics and real-world operation of vessels.
| Access | Amazon Data Exchange |
| Region | Europe |
| Format | CSV |
| Frequency | daily |
| Granularity | daily |
| History | ≥ 2013 |
Go to product
eZ-Ops | Automated Trading Solution
With its user-friendly interface, available algorithms and vast range of parameters, you can easily optimise your intraday positions and available flexibilities.
Energy One's comprehensive suite of trading modules empowers companies to seamlessly automate their trading activities across Auction bidding and Continuous markets. As a leading Independent Software Vendor (ISV) serving multiple exchanges, we also offer full integration with our advanced scheduling modules, enabling our clients to concentrate on their unique needs and strategic goals, letting the system manage all the nominations requirements and technical connections with NEMOs.
| Access | Web Interface |
| Region | Europe, UK |
| Format | CSV, JSON, XLS, XML |
| Frequency | Real-time |
| Granularity | 15, 30 or 60 min |
| History | On request |
Go to product
CargoMetrics Maritime Emissions - Global Benchmark
Better-Built Data.
The CargoMetrics Maritime Emissions - Global Benchmark products represent the most comprehensive and insightful carbon (CO2) emissions and fuel consumption data available. The products are derived from our industry leading digital representation of the physical characteristics and real-world operation of vessels and are available by vessel class (tanker, dry bulk, container) and vessel size in daily, weekly, and monthly versions.
| Access | Amazon Data Exchange |
| Region | Global |
| Format | CSV |
| Frequency | daily |
| Granularity | daily, weekly, monthly |
| History | ≥ 2013 |
Go to product
CargoMetrics Commodity Packs
Better-Built Data.
The CargoMetrics Commodity Packs measure global seaborne commodity trade by country, comprising more than 90% of global import and export trade volume. Product packs include Coal, Crude Oil, Grains, Iron Ore, LNG, LPG, Palm Oil, and Refined Oil.
| Access | Amazon Data Exchange |
| Region | Global |
| Format | CSV |
| Frequency | daily |
| Granularity | daily, weekly, monthly |
| History | ≥ 2013 |
Go to product
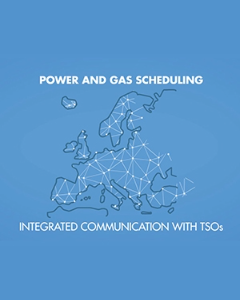
eZ-Ops | Power & Gas Scheduling
SaaS for nominations, scheduling and balancing your portfolio across Europe's energy markets.
eZ-Ops handles nominations, balancing and scheduling across most of Europe's gas and power grids, as well as power exchanges. We support and maintain communication lines with practically every TSO, SSO, Hub, Exchange and Market Operator in Europe. Potential add-ons include algo-trading, auction bidding and asset scheduling which are discussed our 'eZ-Ops | Automated Trading' page.
| Access | Web Interface |
| Region | Europe, UK |
| Format | CSV, JSON, TSO formats, XLS, XML |
| Frequency | Real-time |
| Granularity | 15, 30 or 60 min |
| History | On request |
Go to product


GMSL 24/7 Operations Services
Comprehensive 24/7 outsourced gas and power operations and dispatching services.
Outsourcing your nominations and dispatching functions to GMSL allows you to concentrate on commercial activities to maximise value from your portfolio. We have unrivalled experience of operations in gas and power markets across Europe.
In case of new requirements or changes to existing markets we have a Business Analysis Team plus a Training & Improvement Team, dedicated to building our experience and spreading best practice throughout GMSL.
Our shift team numbers over 50 staff, providing flexibility for peaks in workload, together with holidays and illness.
| Access | API, Email, sFTP, Web Interface |
| Region | Europe |
| Format | CSV, JSON, XLS, XML |
| Frequency | Real-time |
| Granularity | As per market requirements |
Go to product

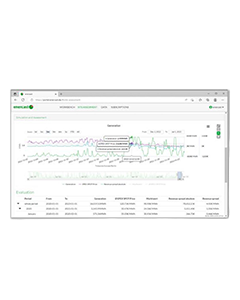
enercast PFS | Power Generation Site Forecast
Power generation forecasts enable the integration of wind and solar energy into power grids and energy markets. enercast PFS is designed to deliver accurate forecasts for individual plants or entire wind or solar parks.
Based on plant data, historical meter data and operational data provided by the customer, as well as up to 10 weather models, enercast PFS forecasts the power output for anywhere between 15 minutes and 31 days ahead.
The resulting forecasts are delivered in real time in a variety of formats via e-mail, FTP and a powerful API. The forecasts can also be visualized and configured through the enercast portal.
| Access | API, Email, FTP, sFTP, Web Interface |
| Region | Asia, AT, BE, BG, CH, CZ, DE, DK, ES, Europe, FR, FI, GB, Global, GR, HU, IE, IT, JP, LU, NL, NO, North America, PL, PO, PT, RO, RS, RU, SE, SI, SK, TR, UK, US |
| Format | CSV, HTML, JSON |
| Frequency | ≥ 15min |
| Granularity | ≥ 15min |
| History | On request |
Go to product

GMSL EuroRunner | Gas Scheduling Solution
SaaS Portfolio Management solution for European gas shippers.
EuroRunner is a comprehensive gas portfolio management system, allowing you to balance your positions across the European gas networks. Easily coping with complex portfolios and capable of managing a wide range of nominations requirements.
EuroRunner is compatible with over 25 market areas and TSOs, breaking down complexity, managing flexibility and fully adaptable to changing markets and portfolios.
| Access | Email, sFTP, Web Interface |
| Region | Europe |
| Format | CSV, XLS, XML |
| Frequency | Real-time |
| Granularity | hourly, daily |
Go to product

Market Access
Entering new energy markets has never been easier.
Time2Market offers a complete market entry package, which ensures you are ready to trade on the new market in a compliant manner and according to all requirements, regardless of your company's legal structure, current trading activities, and business plan.
A trading or shipping license, BRP status, exchange access, and settlement and clearing bank setup are all included in our market entry procedures. Additionally, we work closely with best-in-class partners who can reliably provide the services which we do not offer in-house.
| Access | Email, Physical Meeting, Virtual Meeting |
| Region | Australia, Europe, North America |
| Format | CSV, PDF |
Go to product
enercast YAS | Yield Assessment for Power Generation Sites
enercast YAS is a backcasting tool for wind and solar generation sites. Proven enercast forecast models are used to simulate the power output of existing or projected plants, enabling a market-oriented yield assessment for the site.
With options to add trained backcasts and use realworld forecast configurations, you can accurately replicate historical forecast computation in an instant. This helps incorporate forecastability in the risk assessment of any potential assets, resulting in faster and more profitable portfolio decisions.
| Access | API, Email, FTP, sFTP, Web Interface |
| Region | Asia, AT, BE, BG, CH, CZ, DE, DK, ES, Europe, FR, FI, GB, Global, GR, HU, IE, IT, JP, LU, NL, NO, North America, PL, PO, PT, RO, RS, RU, SE, SI, SK, TR, UK, US |
| Format | CSV, HTML |
| Frequency | Real-time |
| Granularity | ≥ 15min |
| History | 3 years included |
Go to product

enercast WDA | Weather Data Access
Weather is a critical factor for the daily operations of many businesses. enercast WDA provides access to weather forecasts from a large number of numerical weather prediction models from the world’s leading meteorological services.
Weather data from enercast can be combined with other enercast products. They can help with the validation of power forecasts, as well as with the creation of more specialized custom forecasts. Warnings and weather maps specifically inform about critical situations in the field.
| Access | API, Email, FTP, sFTP, Web Interface |
| Region | Asia, AT, BE, BG, CH, CZ, DE, DK, ES, Europe, FR, FI, GB, Global, GR, HU, IE, IT, JP, LU, NL, NO, North America, PL, PO, PT, RO, RS, RU, SE, SI, SK, TR, UK, US |
| Format | CSV, HTML, JSON |
| Frequency | ≥ 15min |
| Granularity | ≥ 15min |
| History | On request |
Go to product

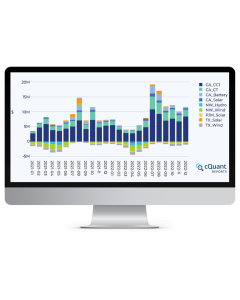
cQuant Analytics Platform
Powering the Future of Energy and Commodity Analytics
Are you still using spreadsheets, old software, or building one-off analytics? Our modern analytics platform enables portfolio and risk managers to do more, faster. The cQuant analytics platform is cloud-native, accessible from anywhere, and requires minimal set up time. The cQuant Analytics Platform provides simulation based analytics of prices, assets, contracts and entire portfolios. cQuant enables companies to plan, optimize and manage their energy and commodity portfolio.
Access our Analytics Platform for:
- Price forecasting & simulation
- Total Portfolio Analysis
- Renewable & carbon analysis
- Battery storage optimization
- Portfolio optimization
- Hedge optimization
- Risk assessment
| Access | Web Interface |
| Region | Europe, North America |
| Format | CSV, HTML |
| Frequency | daily |
| Granularity | hourly, daily |
| History | 2016 |
Go to product
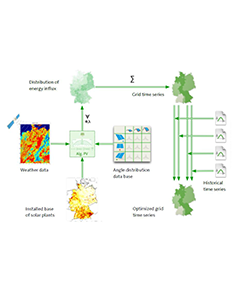
enercast PFA | Power Generation Area Forecast
Power generation forecasts enable the integration of wind and solar energy into power grids and energy markets. enercast PFA is designed to deliver accurate forecasts for the renewable energy generation in any given reference area. This supports active grid control, reduces balancing energy charges, and informs trading decisions.
Based on up to 10 weather models, satellite measurements, reference sites and historical data, enercast forecasts the power output for anywhere between 15 minutes and 31 days ahead.
The resulting forecasts are delivered in real time in a variety of formats via e-mail, FTP and a powerful API.
| Access | API, Email, FTP, sFTP, Web Interface |
| Region | DE |
| Format | CSV, HTML, JSON |
| Frequency | ≥ 15min |
| Granularity | ≥ 15min |
| History | On request |
Go to product


K4View - Energy Market Insight
An innovative consulting platform created by Key to Energy for Power & Gas market participants and operators. Designed to share the information in a uniform, simple and intuitive way. Time and know-how can be dedicated to the core business and not to find and organize market data.
| Access | Web Interface |
| Region | DE, ES, FR, IT |
| Format | CSV, HTML |
| Frequency | Real-time |
| Granularity | hourly |
Go to product

Spotrenewables – Forecasts & Actuals – sFTP
EuroWind’s data service provides wind- and solar power forecasts, nowcasts, and real-time actual data for European countries, market areas, grid-nodes, or individual portfolios.
| Access | sFTP |
| Region | AT, BE, BG, CH, CZ, DE, DK, ES, FR, FI, GB, GR, HU, IE, IT, NL, NO, PO, PT, RO, SE, SI, SK, TR, UK |
| Format | CSV, XML |
| Frequency | 15min |
| Granularity | 15min |
| History | On Request |
Go to product


EEX Transparency Data API
Real-time data for power & gas markets. Obtain original transparency data for power, gas and renewables as well as ad-hoc messages from the EEX Transparency Platform. Get prompt information on planned and unplanned outages of physical assets.
| Access | API |
| Region | AL, AT, BE, CH, CZ, DE, DK, ES, FR, FI, GB, GR, HU, IE, IT, LT, LV, NL, PL, RO, SE |
| Format | CSV, JSON, XML |
| Frequency | Real-time |
| Granularity | 15min |
| History | > 2015 |