Go to product
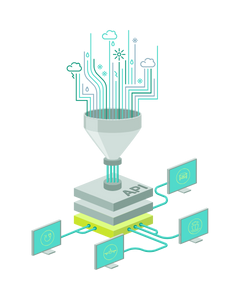
Weather API
High-Resolution Weather Intelligence That Drives Energy Performance.
The Meteomatics Weather API turns weather data into a strategic advantage for energy companies. Instead of juggling fragmented sources, you get a single, high-reliability feed that delivers exactly the insights needed to forecast supply, balance the grid, protect assets, and optimize trading decisions.
| Access | API |
| Region | Global |
| Format | CSV, HTML, JSON, NetCDF, XML |
| Frequency | ≥ 5min |
| Granularity | 90 meters |
| History | ≥ 1940 |
Go to product
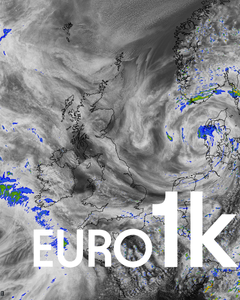
EURO1k
Precision Weather Intelligence for High-Stakes Energy Decisions.
EURO1k gives energy companies the hyperlocal clarity they need to optimize renewable output, stabilize the grid, and improve trading performance, even in the most weather-sensitive regions of Europe. Instead of relying on coarse global models that blur crucial detail, EURO1k pinpoints the atmospheric dynamics that directly impact operational and commercial outcomes.
| Access | API |
| Region | Europe |
| Format | CSV, HTML, JSON, NetCDF, XML |
| Frequency | hourly |
| Granularity | Native 1 km, 15 min |
| History | ≥ 2023 |
Go to product
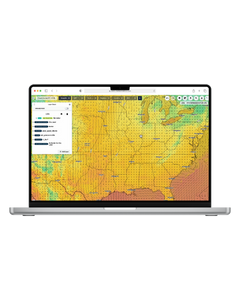
MetX
Weather Intelligence You Can See, Understand, and Act On.
MetX turns high-resolution weather data into immediate operational awareness for energy companies. Instead of sifting through raw forecasts or static dashboards, you get a real-time, interactive view of the conditions that drive generation, demand, and risk, all powered directly by the Meteomatics Weather API.
| Access | Web Interface |
| Region | Global |
| Format | CSV, JSON |
| Frequency | ≥ 5min |
| Granularity | 90 meters |
| History | ≥ 1940 |
Go to product

Portfolio Power Forecasts
Asset-Specific Renewable Forecasts That Strengthen Operations and Trading Performance.
Portfolio Power Forecasts give energy companies a sharper, site-specific view of how their wind, solar, and hydro assets will perform, enabling more accurate planning, tighter risk control, and better commercial results. Instead of relying on generic model output, you get forecasts calibrated to your actual assets, continuously refined with live operational data.
| Access | sFTP |
| Region | Global |
| Format | CSV, JSON, XML |
| Frequency | 15min |
| Granularity | 90 meters |
| History | ≥ 1940 |
Go to product

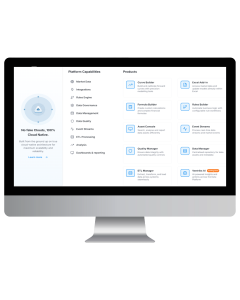
Data Platform
The Complete Data Platform.
A unique open platform, best-in-class data and expertise - all the ingredients for executing critical data management, analytics and business intelligence decisions with confidence.
| Access | API, Cloud, Web Interface |
| Region | Africa, Asia, Europe, Middle-East, North America, South America |
| Format | Cloud formats, CSV, JSON, Python, XLS, XML |
| Frequency | Intra-Day |
| Granularity | 1min |
| History | On request |
Go to product
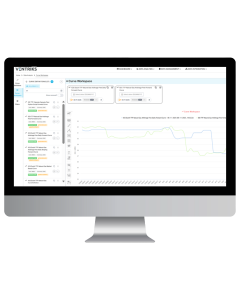
Curve Builder
Monitor, manage, and build forward curves.
Shape and model curves on demand. Create precise mathematical curves for risk modeling, pricing algorithms, and data interpolation with ease.
| Access | API, Cloud, Web Interface |
| Region | Africa, Asia, Europe, Middle-East, North America, South America |
| Format | Cloud formats, CSV, JSON, Python, XLS, XML |
| Frequency | End-of-Day |
| Granularity | 15min |
| History | On request |
Go to product
Data Marketplace
Discover, buy and monetise data.
Our marketplace provides access to premium data sources, supporting asset allocation decisions, portfolio construction, and advanced risk and performance analysis.
| Access | API, Cloud, Web Interface |
| Region | Africa, Asia, Europe, Middle-East, North America, South America |
| Format | Cloud formats, CSV, JSON, Python, XLS, XML |
| Frequency | Intra-Day |
| Granularity | 1min |
| History | On request |
Go to product
API Services
Connect. Integrate. Succeed.
Comprehensive APIs are at the heart of where data meets integration and becomes reality, with the flexibility to connect and create real business value. Integrate Ventriks data seamlessly into your applications with our powerful, developer-friendly APIs. Get started in minutes with comprehensive documentation and code examples.
| Access | API |
| Region | Africa, Asia, Europe, Middle-East, North America, South America |
| Format | Cloud formats, CSV, JSON, Python, XLS, XML |
| Frequency | Intra-Day |
| Granularity | 1min |
| History | On request |
Go to product
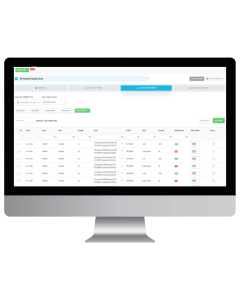
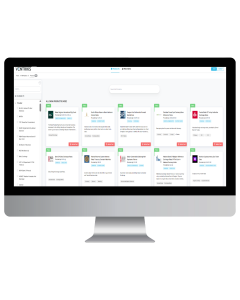
Quality Manager
Infinite Quality Rules.
We help you manage data quality challenges. End-to-end data quality management with ownership, lineage tracking, reporting, and automated workflows.
| Access | API, Cloud, Web Interface |
| Region | Africa, Asia, Europe, Middle-East, North America, South America |
| Format | Cloud formats, CSV, JSON, Python, XLS, XML |
Go to product

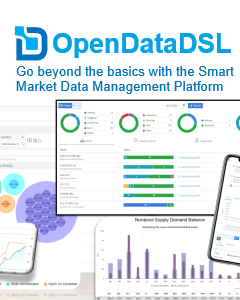
OpenDataDSL Platform
Cloud SaaS Data Management Platform.
Turn complex data into clarity
OpenDataDSL is a cloud-native, ultra-scalable platform designed to transform how businesses manage, model, and interact with market data. By combining transparency, extensibility, and advanced automation, it empowers teams to go beyond the limits of legacy systems.
Why OpenDataDSL?
ODSL Programming Language – A unique domain-specific language that lets “business coders” easily query, transform, and automate workflows with market data.
Operational Transparency – Built-in dashboards, dataset monitoring, and curve management provide unmatched visibility and control across the entire data pipeline.
Extensible by Design – Both the web application and ODSL are designed for partners and clients to create pluggable extensions, ensuring the platform grows with your business.
Cloud-Native & Scalable – Zero-deployment, SaaS-first architecture that adapts seamlessly to your workloads—delivering performance without hidden costs.
Smarter Curves – Advanced curve building tools that use business rules and AI-driven logic to create accurate forward curves, faster.
The Open in OpenDataDSL
Open is more than just a name—it’s a philosophy. We believe in transparency, honesty, and giving customers the ability to build their own insights, KPIs, and workflows without being locked into rigid, opaque platforms.
Shaping the Future of Market Data
With over two decades of expertise in market data systems, OpenDataDSL is built for energy, commodities, and beyond—helping companies unlock real-time analytics, embrace AI, and gain a competitive edge in a rapidly evolving landscape.
| Access | API, Browser, Cloud, Excel, Web Interface |
| Region | Global |
| Format | CSV, HTML, JSON, SaaS, XLS, XML |
Go to product

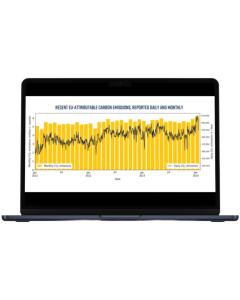
CargoMetrics Maritime Emissions - EU ETS Carbon Tracker
Better-Built Data.
The CargoMetrics Maritime Emissions - EU ETS Carbon Tracker reports daily tons of maritime carbon (CO2) emissions that are subject to the European Union Emissions Trading System (EU ETS), the world’s leading greenhouse gas trading scheme. The Maritime Emissions - EU ETS Carbon Tracker is derived from our industry leading digital representation of the physical characteristics and real-world operation of vessels.
| Access | Amazon Data Exchange |
| Region | Europe |
| Format | CSV |
| Frequency | daily |
| Granularity | daily |
| History | ≥ 2013 |
Go to product
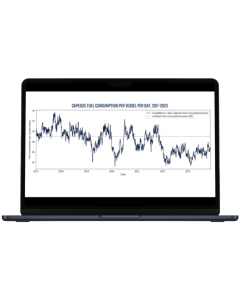
CargoMetrics Maritime Emissions - Global Benchmark
Better-Built Data.
The CargoMetrics Maritime Emissions - Global Benchmark products represent the most comprehensive and insightful carbon (CO2) emissions and fuel consumption data available. The products are derived from our industry leading digital representation of the physical characteristics and real-world operation of vessels and are available by vessel class (tanker, dry bulk, container) and vessel size in daily, weekly, and monthly versions.
| Access | Amazon Data Exchange |
| Region | Global |
| Format | CSV |
| Frequency | daily |
| Granularity | daily, weekly, monthly |
| History | ≥ 2013 |
Go to product
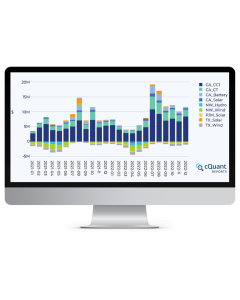
cQuant Analytics Platform
Powering the Future of Energy and Commodity Analytics
Are you still using spreadsheets, old software, or building one-off analytics? Our modern analytics platform enables portfolio and risk managers to do more, faster. The cQuant analytics platform is cloud-native, accessible from anywhere, and requires minimal set up time. The cQuant Analytics Platform provides simulation based analytics of prices, assets, contracts and entire portfolios. cQuant enables companies to plan, optimize and manage their energy and commodity portfolio.
Access our Analytics Platform for:
- Price forecasting & simulation
- Total Portfolio Analysis
- Renewable & carbon analysis
- Battery storage optimization
- Portfolio optimization
- Hedge optimization
- Risk assessment
| Access | Web Interface |
| Region | Europe, North America |
| Format | CSV, HTML |
| Frequency | daily |
| Granularity | hourly, daily |
| History | 2016 |