Go to product

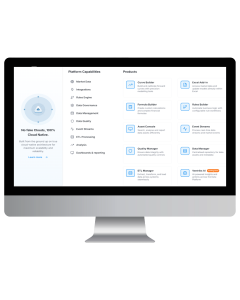
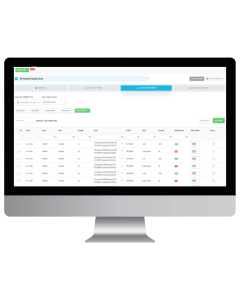
Data Platform
The Complete Data Platform.
A unique open platform, best-in-class data and expertise - all the ingredients for executing critical data management, analytics and business intelligence decisions with confidence.
| Access | API, Cloud, Web Interface |
| Region | Africa, Asia, Europe, Middle-East, North America, South America |
| Format | Cloud formats, CSV, JSON, Python, XLS, XML |
| Frequency | Intra-Day |
| Granularity | 1min |
| History | On request |
Go to product
Curve Builder
Monitor, manage, and build forward curves.
Shape and model curves on demand. Create precise mathematical curves for risk modeling, pricing algorithms, and data interpolation with ease.
| Access | API, Cloud, Web Interface |
| Region | Africa, Asia, Europe, Middle-East, North America, South America |
| Format | Cloud formats, CSV, JSON, Python, XLS, XML |
| Frequency | End-of-Day |
| Granularity | 15min |
| History | On request |
Go to product
Data Marketplace
Discover, buy and monetise data.
Our marketplace provides access to premium data sources, supporting asset allocation decisions, portfolio construction, and advanced risk and performance analysis.
| Access | API, Cloud, Web Interface |
| Region | Africa, Asia, Europe, Middle-East, North America, South America |
| Format | Cloud formats, CSV, JSON, Python, XLS, XML |
| Frequency | Intra-Day |
| Granularity | 1min |
| History | On request |
Go to product
API Services
Connect. Integrate. Succeed.
Comprehensive APIs are at the heart of where data meets integration and becomes reality, with the flexibility to connect and create real business value. Integrate Ventriks data seamlessly into your applications with our powerful, developer-friendly APIs. Get started in minutes with comprehensive documentation and code examples.
| Access | API |
| Region | Africa, Asia, Europe, Middle-East, North America, South America |
| Format | Cloud formats, CSV, JSON, Python, XLS, XML |
| Frequency | Intra-Day |
| Granularity | 1min |
| History | On request |
Go to product
Quality Manager
Infinite Quality Rules.
We help you manage data quality challenges. End-to-end data quality management with ownership, lineage tracking, reporting, and automated workflows.
| Access | API, Cloud, Web Interface |
| Region | Africa, Asia, Europe, Middle-East, North America, South America |
| Format | Cloud formats, CSV, JSON, Python, XLS, XML |
Go to product

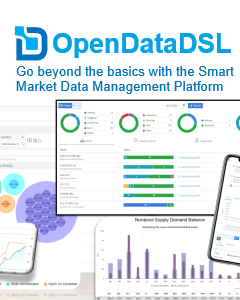
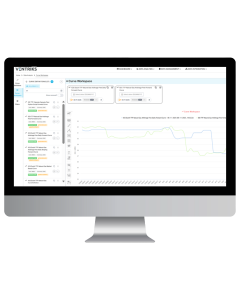
OpenDataDSL Platform
Cloud SaaS Data Management Platform.
Turn complex data into clarity
OpenDataDSL is a cloud-native, ultra-scalable platform designed to transform how businesses manage, model, and interact with market data. By combining transparency, extensibility, and advanced automation, it empowers teams to go beyond the limits of legacy systems.
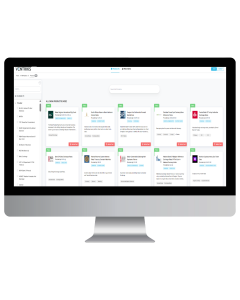
Why OpenDataDSL?
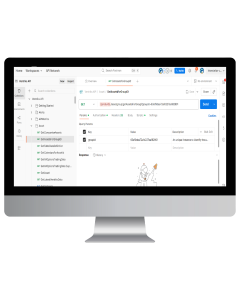
ODSL Programming Language – A unique domain-specific language that lets “business coders” easily query, transform, and automate workflows with market data.
Operational Transparency – Built-in dashboards, dataset monitoring, and curve management provide unmatched visibility and control across the entire data pipeline.
Extensible by Design – Both the web application and ODSL are designed for partners and clients to create pluggable extensions, ensuring the platform grows with your business.
Cloud-Native & Scalable – Zero-deployment, SaaS-first architecture that adapts seamlessly to your workloads—delivering performance without hidden costs.
Smarter Curves – Advanced curve building tools that use business rules and AI-driven logic to create accurate forward curves, faster.
The Open in OpenDataDSL
Open is more than just a name—it’s a philosophy. We believe in transparency, honesty, and giving customers the ability to build their own insights, KPIs, and workflows without being locked into rigid, opaque platforms.
Shaping the Future of Market Data
With over two decades of expertise in market data systems, OpenDataDSL is built for energy, commodities, and beyond—helping companies unlock real-time analytics, embrace AI, and gain a competitive edge in a rapidly evolving landscape.
| Access | API, Browser, Cloud, Excel, Web Interface |
| Region | Global |
| Format | CSV, HTML, JSON, SaaS, XLS, XML |
Go to product


StoneX Commodity Clearing
Connecting clients to markets for 100 years.
We are an institutional-grade financial services franchise that provides global market access, clearing and execution, trading platforms and more to our clients worldwide. As a leading global FCM with roots dating back a century, our comprehensive suite of institutional-grade futures clearing & execution services delivers broad exchange access and transparency to our clients worldwide. StoneX’s robust back-office infrastructure enables us to manage all your clearing and allocation needs with a high degree of efficiency and expertise.
Our clearing services, which include physical delivery, helps our clients mitigate risk and reduce costs, while ensuring transparency in the global marketplace.
| Markets | Derivatives |
| Exchanges | EEX, Others |
| Commodities | Power, Gas, Emissions, Freight |
| Currencies | EUR, USD, GBP, Others |
Go to product


Igloo C/ETRM
High performance SaaS C/ETRM solution.
Igloo is a high-performance SaaS solution designed in collaboration with one of the world’s largest financial energy traders. It offers a state-of-the art user experience, unrivalled exchange connectivity and automated trading of exceptionally high trade volumes.
Built for ease of use, efficiency, control and scalability, Igloo helps curve trading desks for power, oil, gas, LNG, coal and emissions operate with maximum productivity.
| Access | Desktop Application, Web Interface |
| Region | Europe, UK |
| Format | HTML |
| Frequency | Real-time |
| Granularity | 15, 30 or 60 min, daily, monthly |
Go to product

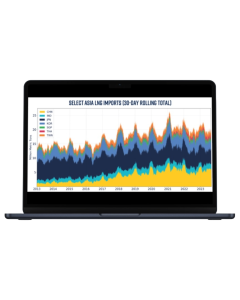
CargoMetrics Commodity Packs
Better-Built Data.
The CargoMetrics Commodity Packs measure global seaborne commodity trade by country, comprising more than 90% of global import and export trade volume. Product packs include Coal, Crude Oil, Grains, Iron Ore, LNG, LPG, Palm Oil, and Refined Oil.
| Access | Amazon Data Exchange |
| Region | Global |
| Format | CSV |
| Frequency | daily |
| Granularity | daily, weekly, monthly |
| History | ≥ 2013 |